上一章ANR-分类以及分析流程我们分析介绍了ANR分类,ANR成因分类,已经ANR分析流程。这一章介绍一下分析ANR需要准备哪些知识。

ANR分析需要的log信息

  • trace信息文件
    • 通过抓取bugreport获取,通常位于bugreport/FS/ANR/目录下。
  • event_log文件
    • 通过抓取bugreport或者debuglog信息获取
  • logcat文件
    • 通过抓取bugreport或者debuglog信息获取

trace信息解释

首先通过下面trace信息介绍一下包含哪些信息,

1
2
3
4
5
6
7
8
9
10
11
12
13
14
15
16
17
18
19
20
21
22
23
24
25
26
27
28
29
30
31
32
33
34
35
36
37
38
39
40
41
42
43
44
45
46
47
48
49
50
51
52
53
54
55
56
57
58
59
60
61
62
63
64
65
66
67
68
69
70
71
72
73
74
75
76
77
78
79
80
81
82
83
84
85
86
87
88
89
90
91
92
93
94
95
96
97
98
99
100
101
102
103
104
// 说明了发生ANR的进程id、时间和进程名称。
----- pid 2023 at 2018-07-24 19:33:17 -----
Cmd line: com.rui.android.poc

// 下面三行是线程的基本信息
JNI: CheckJNI is off; workarounds are off; pins=0; globals=348
DALVIK THREADS://以下是各个线程的函数堆栈信息
(mutexes: tll=0 tsl=0 tscl=0 ghl=0)

// 下面一行说明了线程名称、daemon表示守护进程,线程的优先级(默认5)、线程锁id和线程状态,
// 线程名称是启动线程的时候手动指明的,这里的main标识是主线程,是Android自动设定的
// 一个线程名称,如果是自己手动创建的线程,一般会被命名成“Thread-xx”的格式,其中xx是
// 线程id,它只增不减不会被复用;注意这其中的tid不是线程的id,它是一个在Java虚拟机中用
// 来实现线程锁的变量,随着线程的增减,这个变量的值是可能被复用的;
"main" prio=5 tid=1 NATIVE // 线程状态

// group:是线程组名称。
// sCount:是此线程被挂起的次数,当一个进程被调试后,sCount会重置为0,调试完毕后sCount会根据是否被正常挂起增长,
// dsCount:是线程被调试器挂起的次数,dsCount不会被重置为0,所以dsCount也可以用来判断这个线程是否被调试过
// obj:表示这个线程的Java对象的地址,
// self:表示这个线程Native的地址。
| group="main" sCount=1 dsCount=0 obj=0x4164dcf0 self=0x41565628

// 此后是线程的调度信息,
// sysTid:是Linux下的内核线程id,
// nice:是线程的调度优先级,
// sched:分别标志了线程的调度策略和优先级,
// cgrp:是调度属组,
// handle:是线程的处理函数地址。
| sysTid=2023 nice=-1 sched=0/0 cgrp=apps handle=1074626900

// 线程当前上下文信息,
// state:是调度状态;
// schedstat:从 /proc/[pid]/task/[tid]/schedstat读出,
// 三个值分别表示线程在cpu上执行的时间、线程的等待时间和线程执行的时间片长度,有的
// android内核版本不支持这项信息,得到的三个值都是0
// utm:是线程用户态下使用的时间值(单位是jiffies);
// stm:是内核态下的调度时间值;
// core:是最后执行这个线程的cpu核的序号。
| state=S schedstat=( 0 0 0 ) utm=49 stm=21 core=0

// 线程的调用栈信息(这里可查看导致ANR的代码调用流程,分析ANR最重要的信息)
(native backtrace unavailable)
at libcore.io.Posix.open(Native Method)
at libcore.io.BlockGuardOs.open(BlockGuardOs.java:110)
at libcore.io.IoBridge.open(IoBridge.java:430)
at java.io.FileInputStream.<init>(FileInputStream.java:78)
at com.ruiven.android.Peripheral.util.kingFiles.write(kingFiles.java:58)
at com.ruiven.android.Peripheral.util.kingFiles.write(kingFiles.java:51)
at com.ruiven.android.Peripheral.util.kingLog.writeToFiles(kingLog.java:71)
at com.ruiven.android.Peripheral.util.kingLog.f(kingLog.java:47)
at com.ruiven.android.poc.receiver.ReceiverBatteryChanged.onReceive(ReceiverBatteryChanged.java:114)
at android.app.LoadedApk$ReceiverDispatcher$Args.run(LoadedApk.java:767)
at android.os.Handler.handleCallback(Handler.java:769)
at android.os.Handler.dispatchMessage(Handler.java:97)
at android.os.Looper.loop(Looper.java:136)
at com.ruiven.android.Peripheral.util.Cockroach$1.run(Cockroach.java:38)
at android.os.Handler.handleCallback(Handler.java:769)
at android.os.Handler.dispatchMessage(Handler.java:97)
at android.os.Looper.loop(Looper.java:136)
at android.app.ActivityThread.main(ActivityThread.java:5375)
at java.lang.reflect.Method.invokeNative(Native Method)
at java.lang.reflect.Method.invoke(Method.java:515)
at com.android.internal.os.ZygoteInit$MethodAndArgsCaller.run(ZygoteInit.java:976)
at com.android.internal.os.ZygoteInit.main(ZygoteInit.java:792)
at dalvik.system.NativeStart.main(Native Method)
// Binder线程是进程的线程池中用来处理binder请求的线程
"Binder_3" prio=5 tid=23 NATIVE
| group="main" sCount=1 dsCount=0 obj=0x41b765f8 self=0x4f213f18
| sysTid=1347 nice=0 sched=0/0 cgrp=apps handle=1327603952
| state=S schedstat=( 0 0 0 ) utm=0 stm=3 core=1
#00 pc 000205d0 /system/lib/libc.so (__ioctl+8)
#01 pc 0002d01f /system/lib/libc.so (ioctl+14)
#02 pc 0001e519 /system/lib/libbinder.so (android::IPCThreadState::talkWithDriver(bool)+140)
#03 pc 0001ec67 /system/lib/libbinder.so (android::IPCThreadState::getAndExecuteCommand()+6)
#04 pc 0001ecfd /system/lib/libbinder.so (android::IPCThreadState::joinThreadPool(bool)+48)
#05 pc 000236cd /system/lib/libbinder.so
#06 pc 0000ea19 /system/lib/libutils.so (android::Thread::_threadLoop(void*)+216)
#07 pc 0004e769 /system/lib/libandroid_runtime.so (android::AndroidRuntime::javaThreadShell(void*)+68)
#08 pc 0000e54b /system/lib/libutils.so
#09 pc 0000d240 /system/lib/libc.so (__thread_entry+72)
#10 pc 0000d3dc /system/lib/libc.so (pthread_create+240)
at dalvik.system.NativeStart.run(Native Method)
// JDWP线程是支持虚拟机调试的线程,daemon表示守护进程,不需要关心
"JDWP" daemon prio=5 tid=4 VMWAIT
| group="system" sCount=1 dsCount=0 obj=0x41a21868 self=0x4cc821b0
| sysTid=785 nice=0 sched=0/0 cgrp=apps handle=1257589656
| state=S schedstat=( 0 0 0 ) utm=0 stm=0 core=1
#00 pc 00021420 /system/lib/libc.so (recvmsg+8)
#01 pc 000668ab /system/lib/libdvm.so
#02 pc 00066adf /system/lib/libdvm.so
#03 pc 000697af /system/lib/libdvm.so
#04 pc 00059fdd /system/lib/libdvm.so
#05 pc 0000d240 /system/lib/libc.so (__thread_entry+72)
#06 pc 0000d3dc /system/lib/libc.so (pthread_create+240)
at dalvik.system.NativeStart.run(Native Method)
// “Signal Catcher”负责接收和处理kernel发送的各种信号,例如SIGNAL_QUIT、SIGNAL_USR1等就是被该线程
// 接收到并处理的,traces.txt 文件中的内容就是由该线程负责输出的,可以看到它的状态是RUNNABLE.
"Signal Catcher" daemon prio=5 tid=3 RUNNABLE
| group="system" sCount=0 dsCount=0 obj=0x41a21770 self=0x4af3e5e0
| sysTid=784 nice=0 sched=0/0 cgrp=apps handle=1257677168
| state=R schedstat=( 0 0 0 ) utm=2 stm=2 core=1
at dalvik.system.NativeStart.run(Native Method)
----- end 2023 -----

线程状态

1
2
3
4
5
6
7
8
9
***特别说明一下MONITOR状态和SUSPEND状态,MONITOR状态一般是类的同步块或者同步方法造成的,SUSPENDED状态在debugger的时候会出现,可以用来区别是不是真的是用户正常操作跑出了ANR。*

mutexes(互斥)的选项简写对应含义:
tll--thread list lock
tsl-- thread suspend lock
tscl-- thread suspend count lock
ghl--gc heap lock
hwl--heap worker lock
hwll--heap worker list lock

注意

1
2
trace信息中的线程状态是CPP状态
main线程处于 BLOCK、WAITING、TIMEWAITING状态,那基本上是函数阻塞导致ANR; 如果main线程无异常,则应该排查CPU负载和内存环境。

实例

这里是出现几种线程状态的实例。

TIMED_WAIT

1
2
3
4
5
6
7
8
9
10
11
12
13
14
15
16
17
18
19
20
21
22
23
24
25
26
27
28
29
30
DALVIK THREADS:
"main" prio=5 tid=3 TIMED_WAIT
| group="main" sCount=1 dsCount=0 s=0 obj=0x400143a8
| sysTid=691 nice=0 sched=0/0 handle=-1091117924
at java.lang.Object.wait(Native Method)
- waiting on <0x1cd570> (a android.os.MessageQueue)
at java.lang.Object.wait(Object.java:195)
at android.os.MessageQueue.next(MessageQueue.java:144)
at android.os.Looper.loop(Looper.java:110)
at android.app.ActivityThread.main(ActivityThread.java:3742)
at java.lang.reflect.Method.invokeNative(Native Method)
at java.lang.reflect.Method.invoke(Method.java:515)
at com.android.internal.os.ZygoteInit$MethodAndArgsCaller.run(ZygoteInit.java:739)
at com.android.internal.os.ZygoteInit.main(ZygoteInit.java:497)
at dalvik.system.NativeStart.main(Native Method)

"Binder Thread #3" prio=5 tid=15 NATIVE
| group="main" sCount=1 dsCount=0 s=0 obj=0x434e7758
| sysTid=734 nice=0 sched=0/0 handle=1733632
at dalvik.system.NativeStart.run(Native Method)

"Binder Thread #2" prio=5 tid=13 NATIVE
| group="main" sCount=1 dsCount=0 s=0 obj=0x1cd570
| sysTid=696 nice=0 sched=0/0 handle=1369840
at dalvik.system.NativeStart.run(Native Method)

"Binder Thread #1" prio=5 tid=11 NATIVE
| group="main" sCount=1 dsCount=0 s=0 obj=0x433aca10
| sysTid=695 nice=0 sched=0/0 handle=1367448
at dalvik.system.NativeStart.run(Native Method)

Suspended

1
2
3
4
5
6
7
8
9
10
11
12
13
"main" prio=5 tid=1 Suspended
| group="main" sCount=1 dsCount=0 cgrp=bg_non_interactive handle=0x7fa2a39000
| sysTid=16770 nice=-4 sched=0/0 cgrp=bg_non_interactive handle=0x7fa2a39000
| state=S schedstat=( 2661049558440 288674775480 3568435 ) utm=226454 stm=39650 core=1 HZ=100
| heldMutexes=
at android.os.MessageQueue.removeMessages(MessageQueue.java:702)
at android.os.Handler.removeCallbacks(Handler.java:487)
at me.ele.android.lmagex.b$3.println(SourceFile:103)
at android.os.Looper.loop(Looper.java:153)
at android.app.ActivityThread.main(ActivityThread.java:5665)
at java.lang.reflect.Method.invoke!(Native Method)
at com.android.internal.os.ZygoteInit$MethodAndArgsCaller.run(ZygoteInit.java:822)
at com.android.internal.os.ZygoteInit.main(ZygoteInit.java:712)
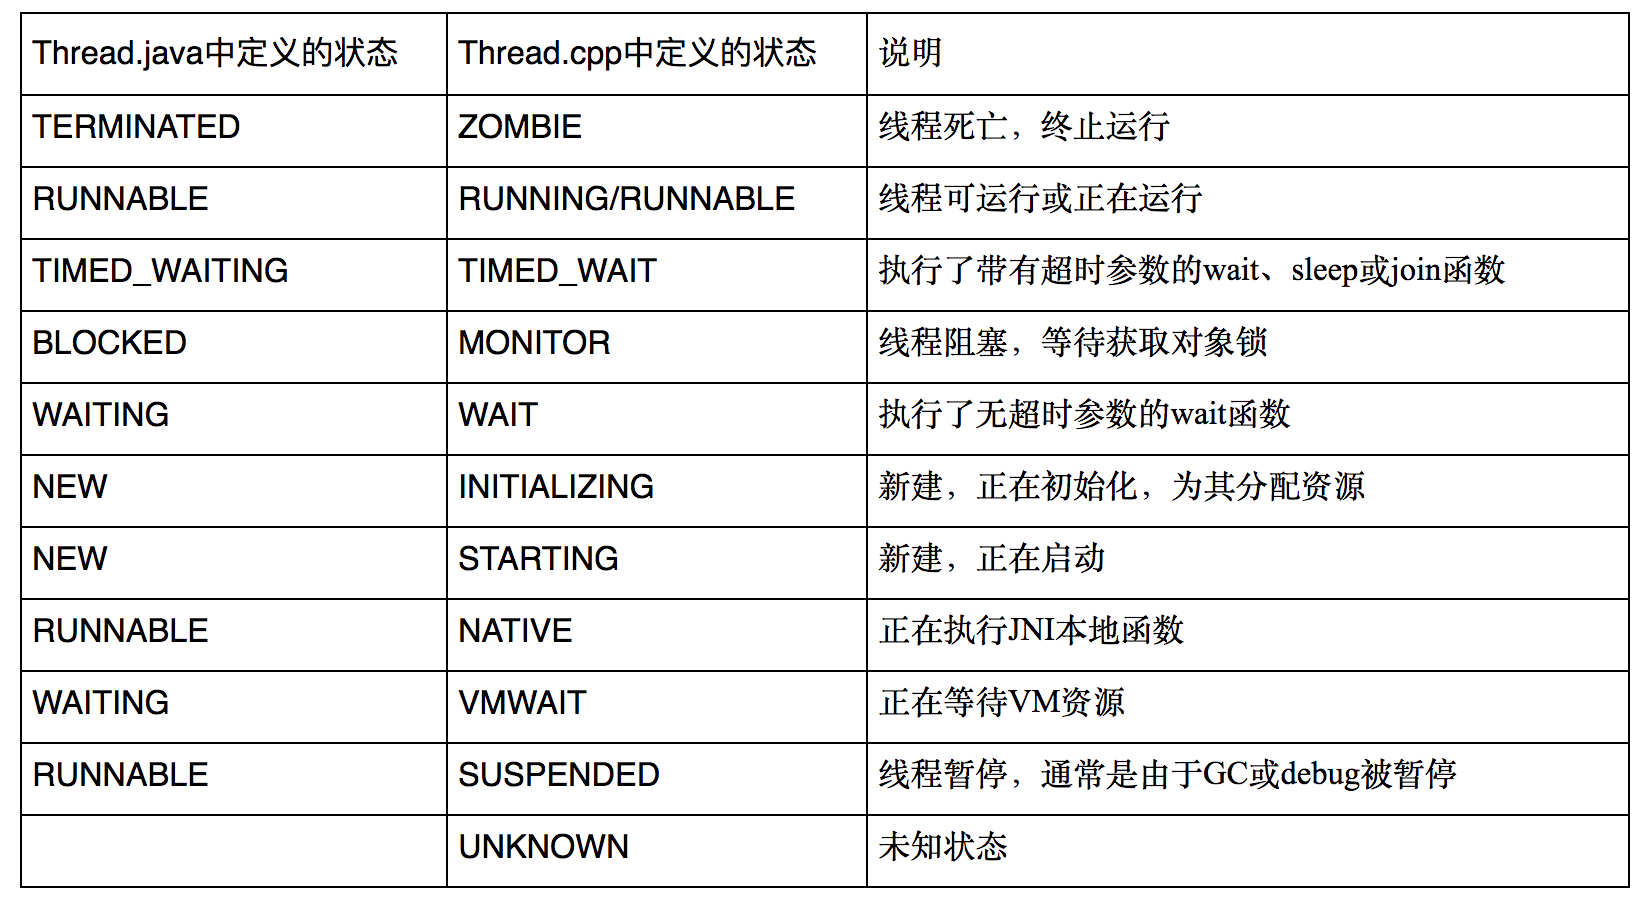
Waiting

1
2
3
4
5
6
7
8
9
10
11
12
13
14
15
16
17
"main" prio=5 tid=1 Waiting
| group="main" sCount=0 dsCount=0 flags=0 obj=0x731a0ec8 self=0xb40000753e8b6c00
| sysTid=28146 nice=-10 cgrp=default sched=0/0 handle=0x753fe804f8
| state=? schedstat=( 0 0 0 ) utm=0 stm=0 core=0 HZ=100
| stack=0x7fd0403000-0x7fd0405000 stackSize=8192KB
| held mutexes=
at java.lang.Object.wait(Native method)
- waiting on <0x025d68dd> (a android.opengl.GLSurfaceView$GLThreadManager)
at java.lang.Object.wait(Object.java:442)
at java.lang.Object.wait(Object.java:568)
at android.opengl.GLSurfaceView$GLThread.onPause(GLSurfaceView.java:1731)
at android.opengl.GLSurfaceView.onPause(GLSurfaceView.java:579)
at com.amap.api.mapcore.util.e.onPause(SourceFile:117)
at com.amap.api.mapcore.util.e.onDetachedGLThread(SourceFile:73)
at com.amap.api.mapcore.util.c.destroy(SourceFile:5750)
at com.amap.api.mapcore.util.t.onDestroy(SourceFile:207)
at com.amap.api.maps.MapView.onDestroy(SourceFile:165)